If you experience issues with high CPU, RAM or disk usage, you can use a couple of integrated utilities in Windows to identify bottlenecks, and fix those issues.
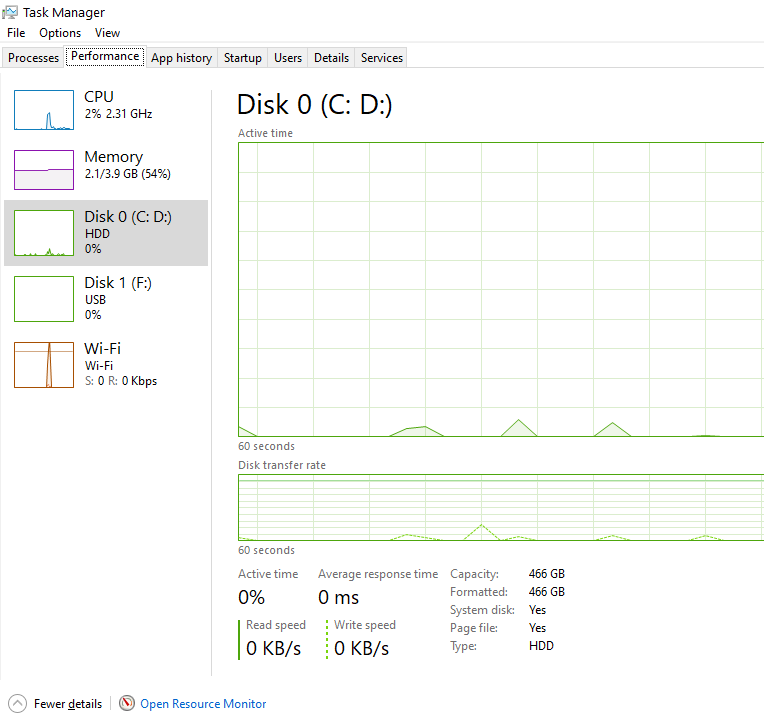
We have already mentioned Task Manager, and it provides the basic performance view, through which you can get quick information on available resources:

Note the Open Resource Monitor button, located at the bottom of the screenshot above and click on it:

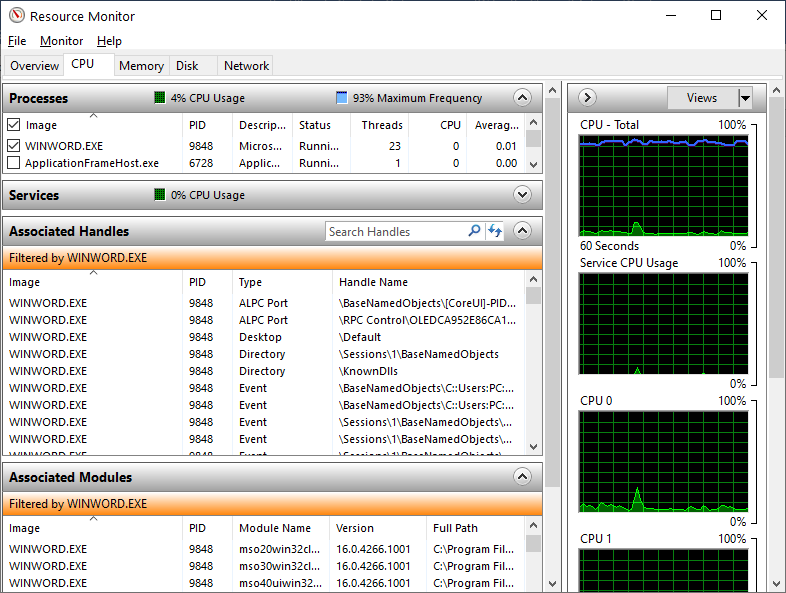
The Resource Monitor is the second tool we want to present. This tool provides a detailed look at your PC’s resource usage. You can select, for example, a process that has high CPU consumption and filter it to show all associated services, modules, handles, disk and network activity. The Resource Monitor provides much more detailed resource statistics than does the Task Manager.
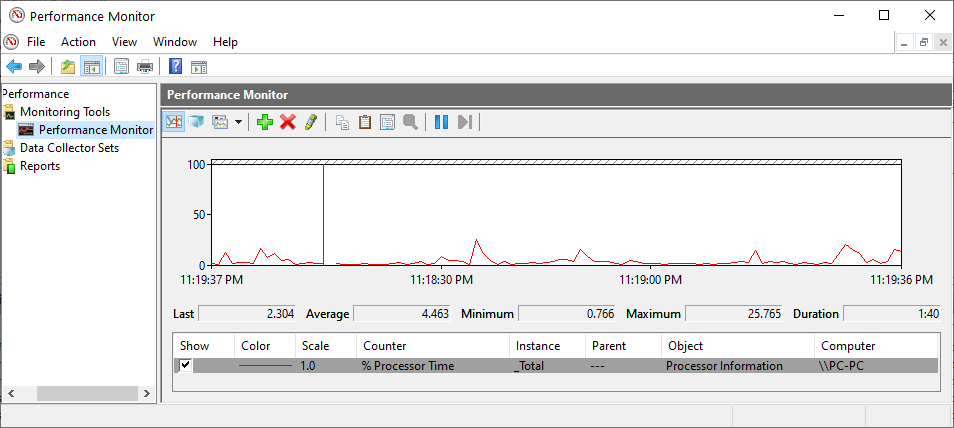
Another great tool you might want to use to track performance of your PC is the Performance Monitor. Click on the Start button, type in perfmon and press Enter:

The Performance Monitor can display performance data from hundreds of different performance counters. You can use it to monitor and log your PC’s performance over specific period of time, e.g. during your rehearsal, or you can monitor the performance of a remote computer in real-time.
Additionally, if you right click on Monitoring tools, and select View system reliability… you can use the Reliability Monitor, and measure hardware and software problems and other changes to your computer.